
With the system tuning (part 1), I expected to get very stable benchmarks and so I started to benchmark seriously my FASTCALL branch of CPython (a new calling convention avoiding temporary tuples).
I was disappointed to get many slowdowns in the CPython benchmark suite. I started to analyze why my change introduced performance regressions.
I took my overall patch and slowly reverted more and more code to check which changes introduced most of the slowdowns.
I focused on the call_simple benchmark which does only one thing: call Python functions which do nothing. Making Python function calls slower would be a big and inacceptable mistake of my work.
Linux perf
I started to learn how to use the great Linux perf tool to analyze why call_simple was slower. I tried to find a major difference between my reference python and the patched python.
I analyzed cache misses on L1 instruction and data caches. I analyzed stallen CPU cycles. I analyzed all memory events, branch events, etc. Basically, I tried all perf events and spent a lot of time to run benchmarks multiple times.
By the way, I strongly suggest to use perf stat using the --repeat command line option to get an average on multiple runs and see the standard deviation. It helps to get more reliable numbers. I even wrote a Python script implementing --repeat (run perf multiple times, parse the output), before seeing that it was already a builtin feature!
Use perf list to list all available (pre-defined) events.
After many days, I decided to give up with perf.
Cachegrind

Valgrind is a great tool known to detect memory leaks, but it also contains gems like the Cachegrind tool which simulates the CPU caches.
I used Cachegrind with the nice Kcachegrind GUI. Sadly, I also failed to see anything obvious in cache misses between the reference python and the patched python.
strace and ltrace
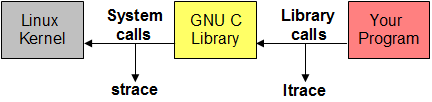
I also tried strace and ltrace tools to try to see a difference in the execution of the reference and the patched pythons. I saw different memory addresses, but no major difference which can explain a difference of the timing.
Morever, the hotcode simply does not call any syscall nor library function. It's pure CPU-bound code.
Compiler options

I used GCC to build to code. Just in case, I tried LLVM compiler, but it didn't "fix" the issue.
I also tried different optimization levels: -O0, -O1, -O2 and -O3.
I read that the exact address of functions can have an impact on the CPU L1 cache: Why does gcc generate 15-20% faster code if I optimize for size instead of speed?. I tried various values of the -falign-functions=N option (1, 2, 6, 12).
I also tried -fomit-pointer (omit frame pointer) to record the callgraph with perf record.
I also tried -flto: Link Time Optimization (LTO).
These compiler options didn't fix the issue.
The truth is out there.
UPDATE: See also Rethinking optimization for size article on Linux Weekly News (LWN): "Such an option has obvious value if one is compiling for a space-constrained environment like a small device. But it turns out that, in some situations, optimizing for space can also produce faster code."
When CPython performance depends on dead code
I continued to revert changes. At the end, my giant patch was reduced to very few changes only adding code which was never called (at least, I was sure that it was not called in the call_simple benchmark).
Let me rephase: adding dead code makes Python slower. What?
A colleague suggested me to remove the body (replace it with return;) of added function: the code became faster. Ok, now I'm completely lost. To be clear, I don't expect that adding dead code would have any impact on the performance.
My email When CPython performance depends on dead code... explains how to reproduce the issue and contains many information.
Solution: PGO
The solution is called Profiled Guided Optimization, "PGO". Python build system supports it in a single command: make profile-opt. It profiles the execution of the Python test suite.
Using PGO, adding dead code has no more impact on the performance.
With system tuning and PGO compilation, benchmarks must now be stable this time, no? ... No, sorry, not yet. We will see more sources of noise in following articles ;-)