I am working on the CPython benchmark suite (performance) and I run the benchmark suite to upload results to speed.python.org. While analying results, I noticed a temporary peak on the call_method benchmark at October 19th:
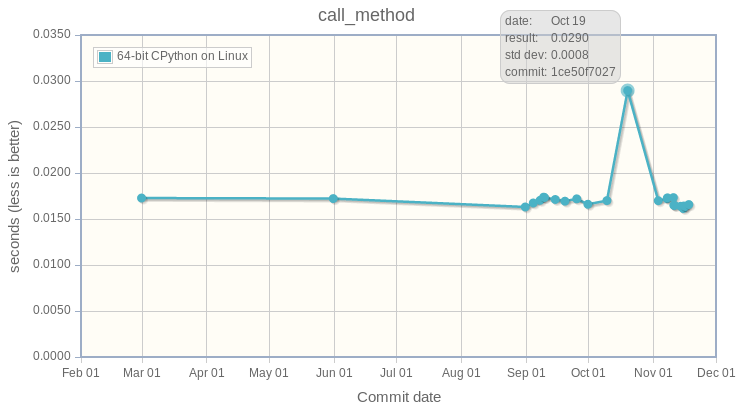
The graphic shows the performance of the call_method microbenchmark between Feb 29, 2016 and November 17, 2016 on the default branch of CPython. The average is around 17.2 ms, whereas the peak is at 29.0 ms: 68% slower!
The server has two "Intel(R) Xeon(R) CPU X5680 @ 3.33GHz" CPUs, total: 24 logical cores (12 physical cores with HyperThreading). This CPU was launched in 2010 and based on the Westmere-EP microarchitecture. Westmere-EP is based on Westmere, which is the 32 nm shrink of the Nehalem microarchitecture.
Reproduce results
Before going too far, the first step is to validate that results are reproductible: reboot the computer, recompile Python, run again the benchmark.
Instead of running the full benchmark suite, install Python, ..., we will run directly the benchmark manually using the Python freshly built in its source code directory.
Interesting dots on the graphic (can be seen at speed.python.org, not on the screenshot):
- 678fe178da0d, Oct 09, 17.0 ms: "Fast"
- 1ce50f7027c1, Oct 19, 28.9 ms: "Slow"
- 36af3566b67a, Nov 3, 16.9 ms: Fast again
I use the following directories:
- ~/perf: GitHub haypo/perf project
- ~/performance: GitHub python/performance project
- ~/cpython: Mercurial CPython repository
Tune the system for benchmarks:
sudo python3 -m perf system tune
Note: all system commands in this article are optional. They help to reduce the operating system jitter (make benchmarks more reliablee).
Fast:
$ hg up -C -r 678fe178da0d
$ ./configure --with-lto -C && make clean && make
$ mv python python-fast
$ PYTHONPATH=~/perf ./python-fast ~/performance/performance/benchmarks/bm_call_method.py --inherit-environ=PYTHONPATH --fast
call_method: Median +- std dev: 17.0 ms +- 0.1 ms
Slow:
$ hg up -C -r 1ce50f7027c1
$ ./configure --with-lto -C && make clean && make
$ mv python python-slow
$ PYTHONPATH=~/perf ./python-slow ~/performance/performance/benchmarks/bm_call_method.py --inherit-environ=PYTHONPATH --fast
call_method: Median +- std dev: 29.3 ms +- 0.9 ms
We reproduced the significant benchmark result: 17 ms => 29 ms.
I use ./configure and make clean instead of incremental compilation, make command, to avoid compilation errors, and to avoid potential side effects only caused by the incremental compilation.
Analysis with the Linux perf tool
To collect perf events, we will run the benchmark with --worker to run a single process and with -w0 -n100 to run the benchmark long enough: 100 samples means at least 10 seconds (a single sample takes at least 100 ms).
First, reset the system configuration to reset the Linux perf configuration:
sudo python3 -m perf system reset
Note: python3 -m perf system tune reduces the sampling rate of Linux perf to reduce operating system jitter.
perf stat
Command to get general statistics on the benchmark:
$ perf stat ./python-slow ~/performance/performance/benchmarks/bm_call_method.py --inherit-environ=PYTHONPATH --worker -v -w0 -n100
"Fast" results:
Performance counter stats for ./python-fast:

      3773.585194 task-clock (msec)         #    0.998 CPUs utilized
              369 context-switches          #    0.098 K/sec
                0 cpu-migrations            #    0.000 K/sec
            8,300 page-faults               #    0.002 M/sec
   12,981,234,867 cycles                    #    3.440 GHz                     [83.27%]
    1,460,980,720 stalled-cycles-frontend   #   11.25% frontend cycles idle    [83.36%]
      435,806,788 stalled-cycles-backend    #    3.36% backend  cycles idle    [66.72%]
   29,982,530,201 instructions              #    2.31  insns per cycle
                                            #    0.05  stalled cycles per insn [83.40%]
    5,613,631,616 branches                  # 1487.612 M/sec                   [83.40%]
       16,006,564 branch-misses             #    0.29% of all branches         [83.27%]

      3.780064486 seconds time elapsed
"Slow" results:
Performance counter stats for ./python-slow:

      5906.239860 task-clock (msec)         #    0.998 CPUs utilized
              556 context-switches          #    0.094 K/sec
                0 cpu-migrations            #    0.000 K/sec
            8,393 page-faults               #    0.001 M/sec
   20,651,474,102 cycles                    #    3.497 GHz                     [83.36%]
    8,480,803,345 stalled-cycles-frontend   #   41.07% frontend cycles idle    [83.37%]
    4,247,826,420 stalled-cycles-backend    #   20.57% backend  cycles idle    [66.64%]
   30,011,465,614 instructions              #    1.45  insns per cycle
                                            #    0.28  stalled cycles per insn [83.32%]
    5,612,485,730 branches                  #  950.264 M/sec                   [83.36%]
       13,584,136 branch-misses             #    0.24% of all branches         [83.29%]

      5.915402403 seconds time elapsed
Significant differences, Fast => Slow:
- Instruction per cycle: 2.31 => 1.45
- stalled-cycles-frontend: 11.25% => 41.07%
- stalled-cycles-backend: 3.36% => 20.57%
The increase of stalled cycles is interesting. Since the code is supposed to be identical, it probably means that fetching instructions is slower. It sounds like an issue with CPU caches.
Statistics on the CPU L1 instruction cache
The perf list command can be used to get the name of events collecting statistics on the CPU L1 instruction cache:
$ perf list | grep L1
  L1-icache-loads                                    [Hardware cache event]
  L1-icache-load-misses                              [Hardware cache event]
  (...)
Collect statistics on the CPU L1 instruction cache:
PYTHONPATH=~/perf perf stat -e L1-icache-loads,L1-icache-load-misses ./python-slow ~/performance/performance/benchmarks/bm_call_method.py --inherit-environ=PYTHONPATH --worker -w0 -n10
"Fast" statistics:
Performance counter stats for './python-fast (...)':

   10,134,106,571 L1-icache-loads
       10,917,606 L1-icache-load-misses     #    0.11% of all L1-icache hits

      3.775067668 seconds time elapsed
"Slow" statistics:
Performance counter stats for './python-slow (...)':

   10,753,371,258 L1-icache-loads
      848,511,308 L1-icache-load-misses     #    7.89% of all L1-icache hits

      6.020490449 seconds time elapsed
Cache misses on the L1 cache: 0.1% (Fast) => 8.0% (Slow).
The slow Python has 71.7x more L1 cache misses than the fast Python! It can explain the significant performance drop.
perf report
The perf record command can be used to collect statistics on the functions where the benchmark spends most of its time. Commands:
PYTHONPATH=~/perf perf record ./python ~/performance/performance/benchmarks/bm_call_method.py --inherit-environ=PYTHONPATH --worker -v -w0 -n100
perf report
Output:
40.27%  python  python              [.] _PyEval_EvalFrameDefault
10.30%  python  python              [.] call_function
10.21%  python  python              [.] PyFrame_New
 8.56%  python  python              [.] frame_dealloc
 5.51%  python  python              [.] PyObject_GenericGetAttr
 (...)
More than 64% of the time is spent in these 5 functions.
system tune
To run benchmark, tune again the system for benchmarks:
sudo python3 -m perf system tune
hg bisect
To find the revision which introduces the performance slowdown, we use a shell script to automate the bisection of the Mercurial history.
cmd.sh script checking if a revision is fast or slow:
set -e -x
./configure --with-lto -C && make clean && make
rm -f json
PYTHONPATH=~/perf ./python ~/performance/performance/benchmarks/bm_call_method.py --inherit-environ=PYTHONPATH --worker -o json -v
PYTHONPATH=~/perf python3 cmd.py json
cmd.sh uses the following cmd.py script which checks if the benchmark is slow: if it takes longer than 23 ms (average between 17 ans 29 ms):
import perf, sys
bench = perf.Benchmark.load('json')
bad = (29 + 17) / 2.0
ms = bench.median() * 1e3
if ms >= bad:
    print("BAD! %.1f ms >= %.1f ms" % (ms, bad))
    sys.exit(1)
else:
    print("good: %.1f ms < %.1f ms" % (ms, bad))
In the bisection, "good" means "fast" (17 ms), whereas "bad" means "slow" (29 ms). The peak, revision 1ce50f7027c1, is used as the first "bad" revision. The previous fast revision before the peak is 678fe178da0d, our first "good" revision.
Commands to identify the first revision which introduced the slowdown:
hg bisect --reset
hg bisect -b 1ce50f7027c1
hg bisect -g 678fe178da0d
time hg bisect -c ./cmd.sh
3 min 52 sec later:
The first bad revision is:
changeset:   104531:83877018ef97
parent:      104528:ce85a1f129e3
parent:      104530:2d352bf2b228
user:        Serhiy Storchaka <storchaka@gmail.com>
date:        Tue Oct 18 13:27:54 2016 +0300
files:       Misc/NEWS
description:
Issue #23782: Fixed possible memory leak in _PyTraceback_Add() and exception
loss in PyTraceBack_Here().
Thank you hg bisect! I love this tool.
Even if I trust hg bisect, I don't trust benchmarks, so I recheck manually:
Slow:
$ hg up -C -r 83877018ef97
$ ./configure --with-lto -C && make clean && make
$ PYTHONPATH=~/perf ./python ~/performance/performance/benchmarks/bm_call_method.py --inherit-environ=PYTHONPATH --fast
call_method: Median +- std dev: 29.4 ms +- 1.8 ms
Use hg parents to get the latest fast revision:
$ hg parents -r 83877018ef97
changeset:   104528:ce85a1f129e3
(...)

changeset:   104530:2d352bf2b228
branch:      3.6
(...)
Check the parent:
$ hg up -C -r ce85a1f129e3
$ ./configure --with-lto -C && make clean && make
$ PYTHONPATH=~/perf ./python ~/performance/performance/benchmarks/bm_call_method.py --inherit-environ=PYTHONPATH --fast
call_method: Median +- std dev: 17.1 ms +- 0.1 ms
The revision ce85a1f129e3 is fast and the following revision 83877018ef97 is slow. The revision 83877018ef97 introduced the slowdown. We found it!
Analysis of the revision introducing the slowdown
The revision 83877018ef97 changes two files: Misc/NEWS and Python/traceback.c. The NEWS file is only documentation and so must not impact performances. Python/traceback.c is part of the C code and so is more interesting.
The commit only changes two C functions: PyTraceBack_Here() and _PyTraceback_Add(), but perf report didn't show these functions as "hot". In fact, these functions are never called by the benchmark.
The commit doesn't touch the C code used in the benchmark.
Unrelated C change impacting performances reminds me my previous deadcode horror story. The performance difference is probably caused by "code placement": perf stat showed a significant increase of the cache miss rate on the L1 instruction cache.
Use GCC __attribute__((hot))
Using PGO compilation was the solution for deadcode, but PGO doesn't work on Ubuntu 14.04 (the OS used by the benchmark server, speed-python) and PGO seems to make benchmarks less reliable.
I wanted to try something else: mark hot functions using the GCC __attribute__((hot)) attribute. PGO compilation does this automatically.
This attribute only has an impact on the code placement: where functions are loaded in memory. The flag declares functions in the .text.hot ELF section rather than the .text ELF section. Grouping hot functions in the same functions helps to reduce the distance between functions and so enhance the usage of CPU caches.
I wrote and then pushed a patch in the issue #28618: "Decorate hot functions using __attribute__((hot)) to optimize Python".
The patch marks 6 functions as hot:
- _PyEval_EvalFrameDefault()
- call_function()
- _PyFunction_FastCall()
- PyFrame_New()
- frame_dealloc()
- PyErr_Occurred()
Let's try the patch:
$ hg up -C -r 83877018ef97
$ wget https://hg.python.org/cpython/raw-rev/59b91b4e9506 -O patch
$ patch -p1 < patch
$ ./configure --with-lto -C && make clean && make
$ PYTHONPATH=~/perf ./python ~/performance/performance/benchmarks/bm_call_method.py --inherit-environ=PYTHONPATH --fast
call_method: Median +- std dev: 16.7 ms +- 0.3 ms
It's easy to make mistakes and benchmarks are always suprising, so let's retry without the patch:
$ hg up -C -r 83877018ef97
$ ./configure --with-lto -C && make clean && make
$ PYTHONPATH=~/perf ./python ~/performance/performance/benchmarks/bm_call_method.py --inherit-environ=PYTHONPATH --fast
call_method: Median +- std dev: 29.3 ms +- 0.6 ms
The check confirms that the GCC attribute fixed the issue!
Conclusion
On modern Intel CPUs, the code placement can have a major impact on the performance of microbenchmarks.
The GCC __attribute__((hot)) attribute can be used manually to make "hot functions" close in memory to enhance the usage of CPU caches.
To know more about the impact of code placement, see the very good talk of Zia Ansari (Intel) at the LLVM Developers' Meeting 2016: Causes of Performance Swings Due to Code Placement in IA. He describes well "performance swings" like the one described in this article and explains how CPUs work internally and how code placement impacts CPU performances.